Outcomes Report for the 2019-2020 Fiscal Year - Research Support Fund
For an alternative format of this information, contact research@ontariotechu.ca

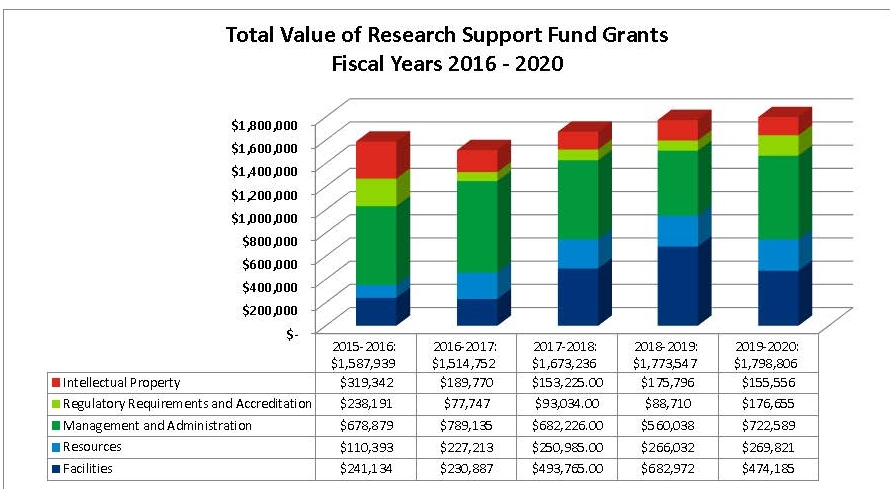
The chart titled "Total Value of Research Support Fund Grants Fiscal Years 2016–2020" presents a stacked bar graph illustrating the distribution of funding across five fiscal years, with total amounts for each year as follows: $1,587,939 in 2015–2016, $1,514,752 in 2016–2017, $1,673,236 in 2017–2018, $1,773,547 in 2018–2019, and $1,798,806 in 2019–2020. Each bar is divided into five categories: 1. Intellectual Property (Red), 2. Regulatory Requirements and Accreditation (Light Green), 3. Management and Administration (Dark Green), 4. Resources (Blue), and 5. Facilities (Dark Blue), with the colours and proportions highlighting the funding allocation for each category within the total grant for the respective year.

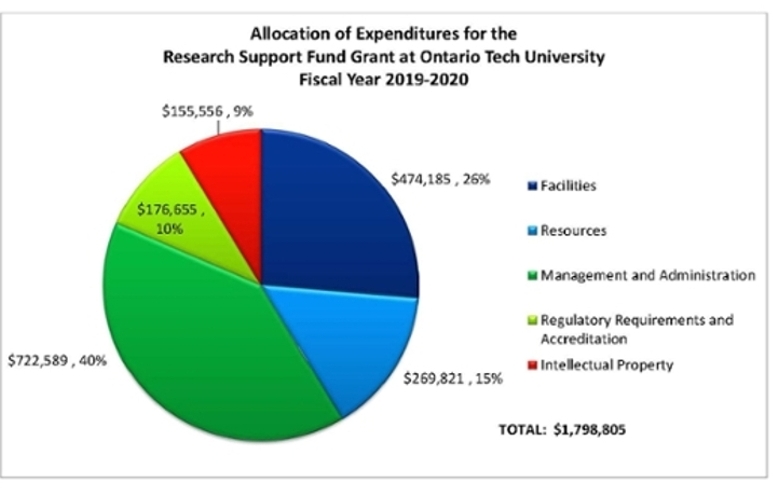
The chart titled "Allocation of Expenditures for the Research Support Fund Grant at Ontario Tech University Fiscal Year 2019–2020" is a pie chart showing the percentage and dollar distribution of a total grant of $1,798,805. The expenditures are divided into five categories: 1. Facilities (Dark Blue, 26%, $474,185), 2. Resources (Light Blue, 15%, $269,821), 3. Management and Administration (Dark Green, 40%, $722,589), 4. Regulatory Requirements and Accreditation (Light Green, 10%, $176,655), and 5. Intellectual Property (Red, 9%, $155,556). Each segment of the pie chart is colour-coded to represent its corresponding category and proportion of the total funding.